A regression task: the prediction of bike sharing demand
The task is to estimate the influence of several variables (like the weather, the season, the day of the week...) on the demand of shared bicycles, so that the authority in charge of the service can organise the service in the best way.
Data origin:
- original full dataset (by hour, not used here): https://archive.ics.uci.edu/ml/datasets/Bike+Sharing+Dataset
- simplified dataset (by day, with some simple scaling): https://www.hds.utc.fr/~tdenoeux/dokuwiki/en/aec
- description: https://www.hds.utc.fr/~tdenoeux/dokuwiki/media/en/exam2019ace.pdf
- data: https://www.hds.utc.fr/~tdenoeux/dokuwiki/media/en/bikesharing_day.csv.zip
Note that even if we are estimating a time series, we are not using a recurrent neural network here as we assume the temporal dependence to be negligible (i.e. $Y_t = f(X_t)$ alone).
Library and data loading
Activating the local environment specific to BetaML documentation
using Pkg
Pkg.activate(joinpath(@__DIR__,"..","..",".."))
Activating project at `~/work/BetaML.jl/BetaML.jl/docs`We first load all the packages we are going to use
using  LinearAlgebra, Random, Statistics, StableRNGs, DataFrames, CSV, Plots, Pipe, BenchmarkTools, BetaML
import Distributions: Uniform, DiscreteUniform
import DecisionTree, Flux ## For comparisons
Here we are explicit and we use our own fixed RNG:
seed = 123 # The table at the end of this tutorial has been obtained with seeds 123, 1000 and 10000
AFIXEDRNG = StableRNG(seed)StableRNGs.LehmerRNG(state=0x000000000000000000000000000000f7)Here we load the data from a csv provided by the BetaML package
basedir = joinpath(dirname(pathof(BetaML)),"..","docs","src","tutorials","Regression - bike sharing")
data    = CSV.File(joinpath(basedir,"data","bike_sharing_day.csv"),delim=',') |> DataFrame
describe(data)| Row | variable | mean | min | median | max | nmissing | eltype |
|---|---|---|---|---|---|---|---|
| Symbol | Union… | Any | Any | Any | Int64 | DataType | |
| 1 | instant | 366.0 | 1 | 366.0 | 731 | 0 | Int64 |
| 2 | dteday | 2011-01-01 | 2012-01-01 | 2012-12-31 | 0 | Date | |
| 3 | season | 2.49658 | 1 | 3.0 | 4 | 0 | Int64 |
| 4 | yr | 0.500684 | 0 | 1.0 | 1 | 0 | Int64 |
| 5 | mnth | 6.51984 | 1 | 7.0 | 12 | 0 | Int64 |
| 6 | holiday | 0.0287278 | 0 | 0.0 | 1 | 0 | Int64 |
| 7 | weekday | 2.99726 | 0 | 3.0 | 6 | 0 | Int64 |
| 8 | workingday | 0.683995 | 0 | 1.0 | 1 | 0 | Int64 |
| 9 | weathersit | 1.39535 | 1 | 1.0 | 3 | 0 | Int64 |
| 10 | temp | 0.495385 | 0.0591304 | 0.498333 | 0.861667 | 0 | Float64 |
| 11 | atemp | 0.474354 | 0.0790696 | 0.486733 | 0.840896 | 0 | Float64 |
| 12 | hum | 0.627894 | 0.0 | 0.626667 | 0.9725 | 0 | Float64 |
| 13 | windspeed | 0.190486 | 0.0223917 | 0.180975 | 0.507463 | 0 | Float64 |
| 14 | casual | 848.176 | 2 | 713.0 | 3410 | 0 | Int64 |
| 15 | registered | 3656.17 | 20 | 3662.0 | 6946 | 0 | Int64 |
| 16 | cnt | 4504.35 | 22 | 4548.0 | 8714 | 0 | Int64 |
The variable we want to learn to predict is cnt, the total demand of bikes for a given day. Even if it is indeed an integer, we treat it as a continuous variable, so each single prediction will be a scalar $Y \in \mathbb{R}$.
plot(data.cnt, title="Daily bike sharing rents (2Y)", label=nothing)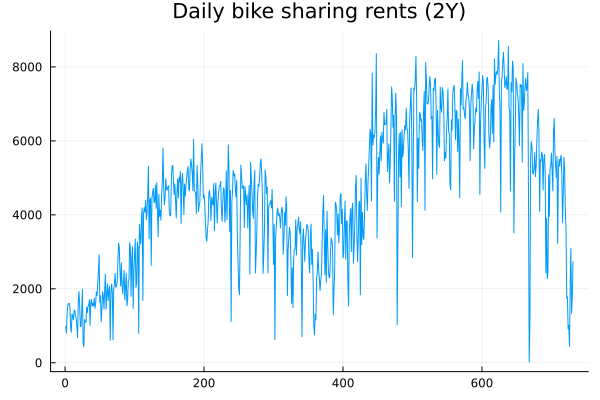
Decision Trees
We start our regression task with Decision Trees.
Decision tree training consists in choosing the set of questions (in a hierarchical way, so as to form indeed a "decision tree") that "best" split the dataset given for training, in the sense that the split generates the sub-samples (always 2 subsamples in the BetaML implementation) that are, for the characteristic we want to predict, as homogeneous as possible. Decision trees are one of the few ML algorithms that have an intuitive interpretation and can be used for both regression and classification tasks.
Data preparation
The first step is to prepare the data for the analysis. This indeed depends already on the model we want to employ, as some models "accept" almost everything as input, no matter if the data is numerical or categorical, if it has missing values or not... while other models are instead much more demanding, and require more work to "clean up" our dataset.
The tutorial starts using Decision Tree and Random Forest models that definitely belong to the first group, so the only thing we have to do is to select the variables in input (the "feature matrix", that we will indicate with "X") and the variable representing our output (the information we want to learn to predict, we call it "y"):
x    = Matrix{Float64}(data[:,[:instant,:season,:yr,:mnth,:holiday,:weekday,:workingday,:weathersit,:temp,:atemp,:hum,:windspeed]])
y    = data[:,16];
We finally set up a dataframe to store the relative mean errors of the various models we'll use.
results = DataFrame(model=String[],train_rme=Float64[],test_rme=Float64[])| Row | model | train_rme | test_rme |
|---|---|---|---|
| String | Float64 | Float64 |
Model selection
We can now split the dataset between the data that we will use for training the algorithm and selecting the hyperparameters (xtrain/ytrain) and those for testing the quality of the algorithm with the optimal hyperparameters (xtest/ytest). We use the partition function specifying the share we want to use for these two different subsets, here 75% and 25% respectively. As our data represents indeed a time series, we want our model to be able to predict future demand of bike sharing from past, observed rented bikes, so we do not shuffle the datasets as would be the default.
((xtrain,xtest),(ytrain,ytest)) = partition([x,y],[0.75,1-0.75],shuffle=false)
(ntrain, ntest) = size.([ytrain,ytest],1)
2-element Vector{Int64}:
548
183Then we define the model we want to use, DecisionTreeEstimator in this case, and we create an instance of the model:
m = DecisionTreeEstimator(autotune=true, rng=copy(AFIXEDRNG))DecisionTreeEstimator - A Decision Tree model (unfitted)Passing a fixed Random Number Generator (RNG) to the rng parameter guarantees that every time we use the model with the same data (from the model creation downward to value prediction) we obtain the same results. In particular BetaML provides FIXEDRNG, an instance of StableRNG that guarantees reproducibility even across different Julia versions. See the section "Dealing with stochasticity" for details. Note the autotune parameter. BetaML has perhaps what is the easiest method for automatically tuning the model hyperparameters (thus becoming in this way learned parameters). Indeed, in most cases it is enough to pass the attribute autotune=true to the model constructor and the hyperparameter search will be automatically performed on the first fit! call. If needed we can customise hyperparameter tuning, choosing the tuning method with the parameter tunemethod. The single-line above is equivalent to:
tuning_method = SuccessiveHalvingSearch(
                   hpranges     = Dict("max_depth" =>[5,10,nothing], "min_gain"=>[0.0, 0.1, 0.5], "min_records"=>[2,3,5],"max_features"=>[nothing,5,10,30]),
                   loss         = l2loss_by_cv,
                   res_shares   = [0.05, 0.2, 0.3],
                   multithreads = true
                )
m_dt = DecisionTreeEstimator(autotune=true, rng=copy(AFIXEDRNG), tunemethod=tuning_method)
DecisionTreeEstimator - A Decision Tree model (unfitted)Note that the defaults change according to the specific model, for example RandomForestEstimator autotuning defaults to not being multithreaded, as the individual model is already multithreaded.
Refer to the versions of this tutorial for BetaML <= 0.6 for a good exercise on how to perform model selection using the cross_validation function, or even by custom grid search.
We can now fit the model, that is learn the model parameters that lead to the best predictions from the data. By default (unless we use cache=false in the model constructor) the model also stores the training predictions, so we can just use fit!() instead of fit!() followed by predict(model,xtrain)
ŷtrain = fit!(m_dt,xtrain,ytrain)548-element Vector{Float64}:
988.6666666666666
811.5
1502.5
1502.5
1610.0
1610.0
1502.5
959.0
811.5
1331.5
⋮
7778.142857142857
6786.75
6786.75
7269.6
7269.6
6786.75
5497.0
5687.0
5497.0The above code produces a fitted DecisionTreeEstimator object that can be used to make predictions given some new features, i.e. given a new X matrix of (number of observations x dimensions), predict the corresponding Y vector of scalars in R.
ŷtest = predict(m_dt, xtest)183-element Vector{Float64}:
5497.0
5687.0
5687.0
5497.0
5687.0
5687.0
5687.0
7041.4
7041.4
7041.4
⋮
5459.0
2120.5
5459.0
2120.5
4913.5
5459.0
4169.0
4913.5
5459.0We now compute the mean relative error for the training and the test set. The relative_mean_error is a very flexible error function. Without additional parameters, it computes, as the name says, the relative mean error, between an estimated and a true vector. However it can also compute the mean relative error, also known as the "mean absolute percentage error" (MAPE), or use a p-norm higher than 1. The mean relative error emphasises the relativeness of the error, i.e. all observations and dimensions weigh the same, whether large or small. Conversely, in the relative mean error the same relative error on larger observations (or dimensions) weights more. In this tutorial we use the latter, as our data has clearly some outlier days with very small rents, and we care more about avoiding our customers finding empty bike racks than having unrented bikes on the rack. Targeting a low mean average error would push all our predictions down to try to accommodate the low-level predictions (to avoid a large relative error), and that's not what we want.
We can then compute the relative mean error for the decision tree
rme_train = relative_mean_error(ytrain,ŷtrain) # 0.1367
rme_test = relative_mean_error(ytest,ŷtest) # 0.15470.1625417807785822And we save the relative mean errors in the results dataframe:
push!(results,["DT",rme_train,rme_test]);We can plot the true labels vs the estimated ones for the two subsets...
scatter(ytrain,ŷtrain,xlabel="daily rides",ylabel="est. daily rides",label=nothing,title="Est vs. obs in training period (DT)")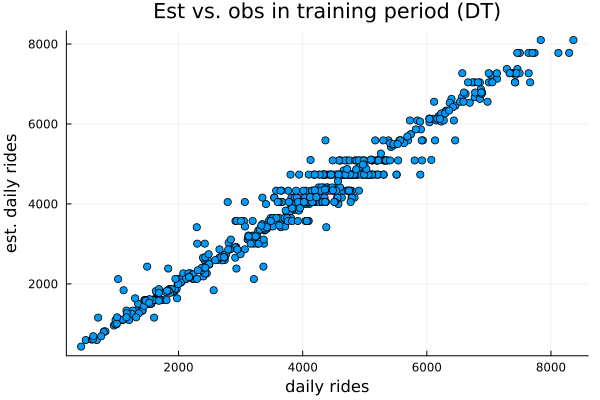
scatter(ytest,ŷtest,xlabel="daily rides",ylabel="est. daily rides",label=nothing,title="Est vs. obs in testing period (DT)")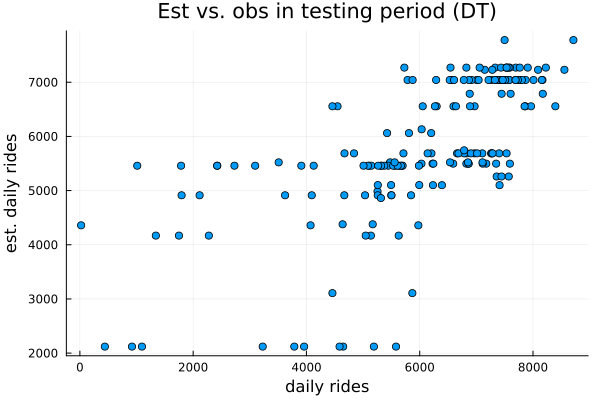
Or we can visualise the true vs estimated bikes shared on a temporal basis. First on the full period (2 years) ...
ŷtrainfull = vcat(ŷtrain,fill(missing,ntest))
ŷtestfull  = vcat(fill(missing,ntrain), ŷtest)
plot(data[:,:dteday],[data[:,:cnt] ŷtrainfull ŷtestfull], label=["obs" "train" "test"], legend=:topleft, ylabel="daily rides", title="Daily bike sharing demand observed/estimated across the\n whole 2-years period (DT)")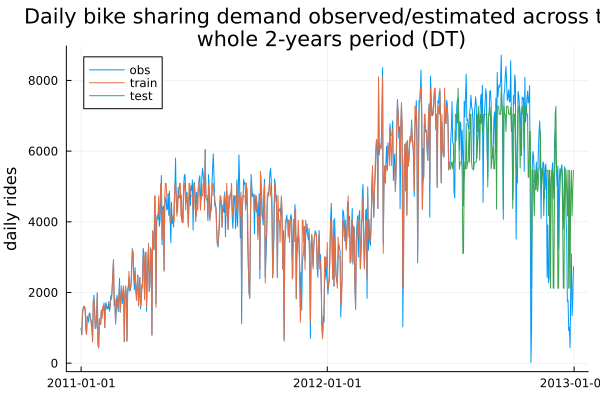
..and then focusing on the testing period
stc = ntrain
endc = size(x,1)
plot(data[stc:endc,:dteday],[data[stc:endc,:cnt] ŷtestfull[stc:endc]], label=["obs" "test"], legend=:bottomleft, ylabel="Daily rides", title="Focus on the testing period (DT)")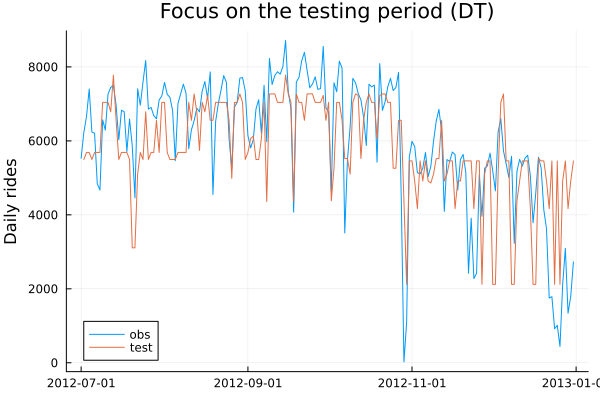
The predictions aren't so bad in this case, however decision trees are highly unstable, and the output could have depended just on the specific initial random seed.
Random Forests
Rather than trying to solve this problem using a single Decision Tree model, let's now try to use a Random Forest model. Random forests average the results of many different decision trees and provide a more "stable" result. Being made of many decision trees, random forests are however more computationally expensive to train.
m_rf      = RandomForestEstimator(autotune=true, oob=true, rng=copy(AFIXEDRNG))
ŷtrain    = fit!(m_rf,xtrain,ytrain);
ŷtest     = predict(m_rf,xtest);
rme_train = relative_mean_error(ytrain,ŷtrain) # 0.056
rme_test  = relative_mean_error(ytest,ŷtest)   # 0.161
push!(results,["RF",rme_train,rme_test]);
Starting hyper-parameters autotuning (this could take a while..)
(e 1 / 7) N data / n candidates / n candidates to retain : 43.84 1296 466
(e 2 / 7) N data / n candidates / n candidates to retain : 54.800000000000004 466 167
(e 3 / 7) N data / n candidates / n candidates to retain : 71.24000000000001 167 60
(e 4 / 7) N data / n candidates / n candidates to retain : 82.2 60 22
(e 5 / 7) N data / n candidates / n candidates to retain : 109.60000000000001 22 8
(e 6 / 7) N data / n candidates / n candidates to retain : 164.4 8 3
(e 7 / 7) N data / n candidates / n candidates to retain : 219.20000000000002 3 1While slower than individual decision trees, random forests remain relatively fast. We should also consider that they are by default efficiently parallelised, so their speed increases with the number of available cores (in building this documentation page, GitHub CI servers allow for a single core, so all the benchmarks you see in this tutorial are run with a single core available).
Random forests support the so-called "out-of-bag" error, an estimation of the error that we would have when the model is applied on a testing sample. However in this case the oob reported is much smaller than the testing error we will actually find. This is due to the fact that the division between training/validation and testing in this exercise is not random, but has a temporal basis. It seems that in this example the data in validation/testing follows a different pattern/variance than those in training (in probabilistic terms, the daily observations are not i.i.d.).
info(m_rf)
oob_error, rme_test  = info(m_rf)["oob_errors"],relative_mean_error(ytest,ŷtest)
In this case we found an error very similar to the one employing a single decision tree. Let's print the observed data vs the estimated one using the random forest and then along the temporal axis:
scatter(ytrain,ŷtrain,xlabel="daily rides",ylabel="est. daily rides",label=nothing,title="Est vs. obs in training period (RF)")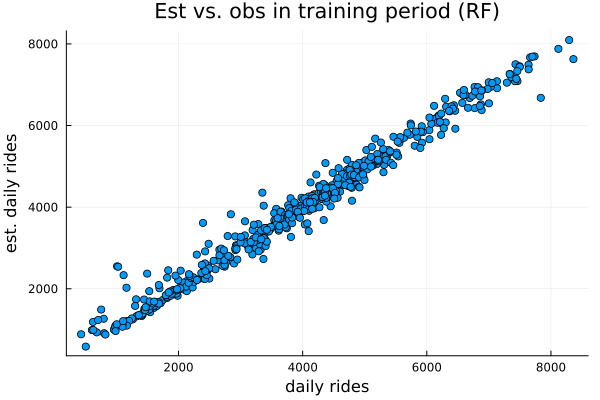
scatter(ytest,ŷtest,xlabel="daily rides",ylabel="est. daily rides",label=nothing,title="Est vs. obs in testing period (RF)")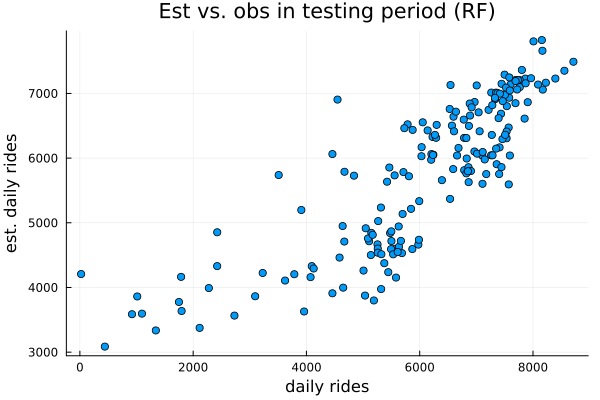
Full period plot (2 years):
ŷtrainfull = vcat(ŷtrain,fill(missing,ntest))
ŷtestfull  = vcat(fill(missing,ntrain), ŷtest)
plot(data[:,:dteday],[data[:,:cnt] ŷtrainfull ŷtestfull], label=["obs" "train" "test"], legend=:topleft, ylabel="daily rides", title="Daily bike sharing demand observed/estimated across the\n whole 2-years period (RF)")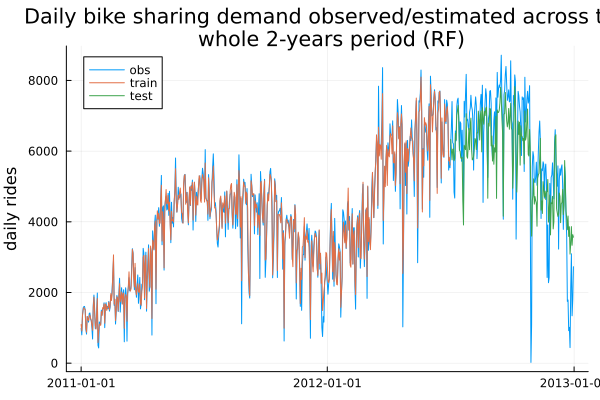
Focus on the testing period:
stc = 620
endc = size(x,1)
plot(data[stc:endc,:dteday],[data[stc:endc,:cnt] ŷtrainfull[stc:endc] ŷtestfull[stc:endc]], label=["obs" "val" "test"], legend=:bottomleft, ylabel="Daily rides", title="Focus on the testing period (RF)")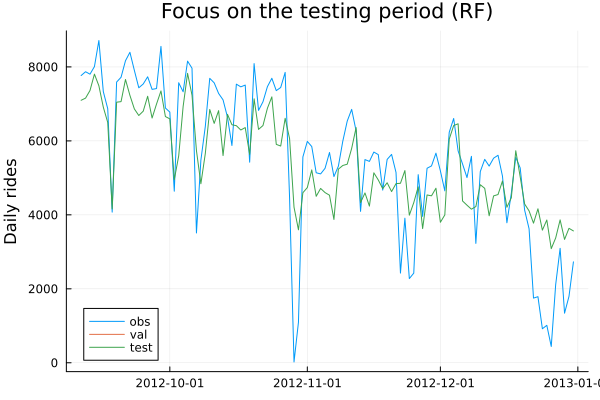
Comparison with DecisionTree.jl random forest
We now compare our results with those obtained employing the same model in the DecisionTree package, using the hyperparameters of the optimal BetaML Random forest model:
best_rf_hp = hyperparameters(m_rf)RandomForestE_hp (a BetaMLHyperParametersSet struct)
- n_trees: 20
- max_depth: nothing
- min_gain: 0.0
- min_records: 3
- max_features: 10
- sampling_share: 1.0
- force_classification: false
- splitting_criterion: nothing
- fast_algorithm: false
- integer_encoded_cols: nothing
- beta: 0.1
- oob: true
- tunemethod: SuccessiveHalvingSearch(BetaML.Utils.l2loss_by_cv, [0.08, 0.1, 0.13, 0.15, 0.2, 0.3, 0.4], Dict{String, Any}("min_gain" => [0.0, 0.1, 0.5], "n_trees" => [10, 20, 30, 40], "max_depth" => Union{Nothing, Int64}[5, 10, nothing], "min_records" => [2, 3, 5], "max_features" => Union{Nothing, Int64}[nothing, 5, 10, 30], "beta" => [0.0, 0.01, 0.1]), false)
Hyperparameters of the DecisionTree.jl random forest model
n_subfeatures=isnothing(best_rf_hp.max_features) ? -1 : best_rf_hp.max_features; n_trees=best_rf_hp.n_trees; partial_sampling=0.7; max_depth=isnothing(best_rf_hp.max_depth) ? typemax(Int64) : best_rf_hp.max_depth;
min_samples_leaf=best_rf_hp.min_records; min_samples_split=best_rf_hp.min_records; min_purity_increase=best_rf_hp.min_gain;
We train the model..
model = DecisionTree.build_forest(ytrain, convert(Matrix,xtrain),
                     n_subfeatures,
                     n_trees,
                     partial_sampling,
                     max_depth,
                     min_samples_leaf,
                     min_samples_split,
                     min_purity_increase;
                     rng = seed)
Ensemble of Decision Trees
Trees: 20
Avg Leaves: 114.1
Avg Depth: 7.15And we generate predictions and measure their error
(ŷtrain,ŷtest) = DecisionTree.apply_forest.([model],[xtrain,xtest]);


(rme_train, rme_test) = relative_mean_error.([ytrain,ytest],[ŷtrain,ŷtest]) # 0.022 and 0.304
push!(results,["RF (DecisionTree.jl)",rme_train,rme_test]);
While the train error is very small, the error on the test set remains relatively high. The very low error level on the training set is a sign that it overspecialised on the training set, and we should rather have run a dedicated hyper-parameter tuning function for the DecisionTree.jl model (we did try using the default DecisionTrees.jl parameters, but we obtained roughly the same results).
Finally we plot the DecisionTree.jl predictions alongside the observed value:
ŷtrainfull = vcat(ŷtrain,fill(missing,ntest))
ŷtestfull  = vcat(fill(missing,ntrain), ŷtest)
plot(data[:,:dteday],[data[:,:cnt] ŷtrainfull ŷtestfull], label=["obs" "train" "test"], legend=:topleft, ylabel="daily rides", title="Daily bike sharing demand observed/estimated across the\n whole 2-years period (DT.jl RF)")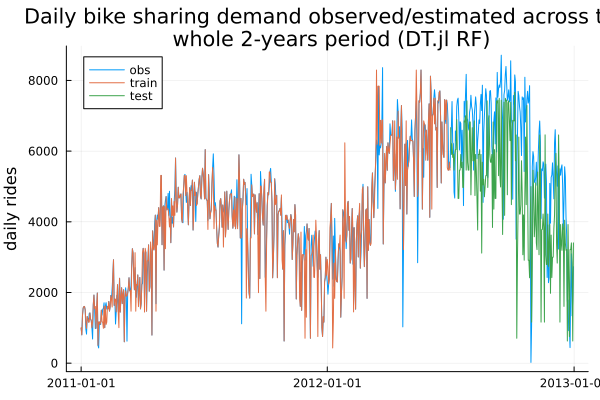
Again, focusing on the testing data:
stc  = ntrain
endc = size(x,1)
plot(data[stc:endc,:dteday],[data[stc:endc,:cnt] ŷtestfull[stc:endc]], label=["obs" "test"], legend=:bottomleft, ylabel="Daily rides", title="Focus on the testing period (DT.jl RF)")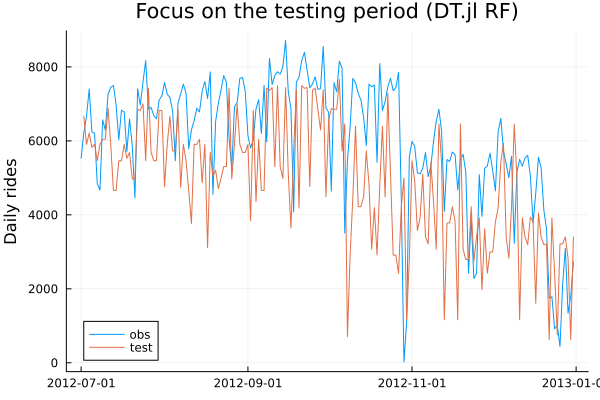
Conclusions of Decision Trees / Random Forests methods
The error obtained employing DecisionTree.jl is significantly larger than those obtained using a BetaML random forest model, although to be fair with DecisionTrees.jl we didn't tune its hyper-parameters. Also, the DecisionTree.jl random forest model is much faster. This is partially due to the fact that, internally, DecisionTree.jl models optimise the algorithm by sorting the observations. BetaML trees/forests don't employ this optimisation and hence they can work with true categorical data for which ordering is not defined. Another explanation of this difference in speed is that BetaML Random Forest models accept missing values within the feature matrix. To sum up, BetaML random forests are ideal algorithms when we want to obtain good predictions in the simplest way, even without manually tuning the hyper-parameters, and without spending time cleaning ("munging") the feature matrix, as they accept almost "any kind" of data as it is.
Neural Networks
BetaML provides only deep forward neural networks, artificial neural network units where the individual "nodes" are arranged in layers, from the input layer, where each unit holds the input coordinate, through various hidden layer transformations, until the actual output of the model:
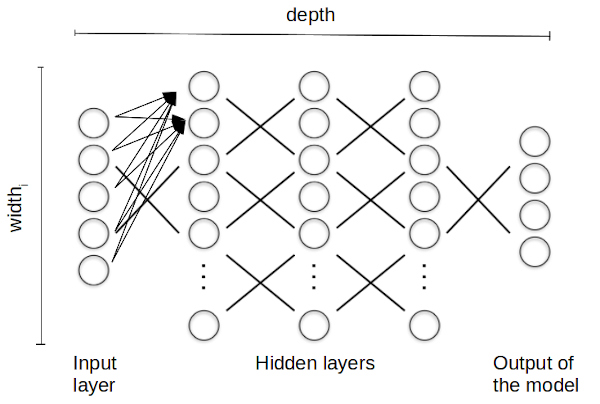
In this layerwise computation, each unit in a particular layer takes input from all the preceding layer units and it has its own parameters that are adjusted to perform the overall computation. The training of the network consists in retrieving the coefficients that minimise a loss function between the output of the model and the known data. In particular, a deep (feedforward) neural network refers to a neural network that contains not only the input and output layers, but also (a variable number of) hidden layers in between.
Neural networks accept only numerical inputs. We hence need to convert all categorical data into numerical units. A common approach is to use the so-called "one-hot-encoding" where the categorical values are converted into indicator variables (0/1), one for each possible value. This can be done in BetaML using the OneHotEncoder function:
seasonDummies  = fit!(OneHotEncoder(),data.season)
weatherDummies = fit!(OneHotEncoder(),data.weathersit)
wdayDummies    = fit!(OneHotEncoder(),data.weekday .+ 1)


# We compose the feature matrix with the new dimensions obtained from the onehotencoder functions
x = hcat(Matrix{Float64}(data[:,[:instant,:yr,:mnth,:holiday,:workingday,:temp,:atemp,:hum,:windspeed]]),
         seasonDummies,
         weatherDummies,
         wdayDummies)
y = data[:,16];
As we did for decision trees/ random forests, we split the data into training, validation and testing sets
((xtrain,xtest),(ytrain,ytest)) = partition([x,y],[0.75,1-0.75],shuffle=false)
(ntrain, ntest) = size.([ytrain,ytest],1)
2-element Vector{Int64}:
548
183Another common operation with neural networks is to scale the feature vectors (X) and the labels (Y). The BetaML Scaler model, by default, scales the data such that each dimension has mean 0 and variance 1.
Note that we can provide the Scaler model with different scale factors or specify the columns that shouldn't be scaled (e.g. those resulting from the one-hot encoding). Finally we can reverse the scaling (this is useful to retrieve the unscaled features from a model trained with scaled ones).
cols_nottoscale = [2;4;5;10:23]
xsm             = Scaler(skip=cols_nottoscale)
xtrain_scaled   = fit!(xsm,xtrain)
xtest_scaled    = predict(xsm,xtest)
ytrain_scaled   = ytrain ./ 1000 # We just divide Y by 1000, as using full scaling of Y we may get negative demand.
ytest_scaled    = ytest ./ 1000
D = size(xtrain,2)23We can now build our feed-forward neural network. We create three layers: the first layer will always have an input size equal to the dimensions of our data (the number of columns), and the output layer size, for a simple regression where the predictions are scalars, will always be one. We will tune the size of the middle layer.
There are already several kinds of layers available (and you can build your own kind by defining a new struct and implementing a few functions. See the Nn module documentation for details). Here we use only dense layers, those found in typical feed-forward neural networks.
For each layer, on top of its size (in "neurons") we can specify an activation function. Here we use the relu for the terminal layer (this will guarantee that our predictions are always positive) and identity for the hidden layer. Again, consult the Nn module documentation for other activation layers already defined, or use any function of your choice.
Initial weight parameters can also be specified if needed. By default DenseLayer uses the so-called Xavier initialisation.
Let's hence build our candidate neural network structures, choosing between 5 and 10 nodes in the hidden layers:
candidate_structures = [
        [DenseLayer(D,k,f=relu,df=drelu,rng=copy(AFIXEDRNG)),     # Activation function is ReLU, its derivative is drelu
         DenseLayer(k,k,f=identity,df=didentity,rng=copy(AFIXEDRNG)), # This is the hidden layer we want to test various sizes
         DenseLayer(k,1,f=relu,df=drelu,rng=copy(AFIXEDRNG))] for k in 5:2:10]
3-element Vector{Vector{DenseLayer{TF, TDF, Float64, Matrix{Float64}, Vector{Float64}} where {TF<:Function, TDF<:Union{Nothing, Function}}}}:
[DenseLayer{typeof(relu), typeof(drelu), Float64, Matrix{Float64}, Vector{Float64}}([-0.29531296438620935 -0.015470333744021791 … 0.22698611148327613 0.2904274420874035; -0.12268047123900877 0.24439218426433357 … 0.36149589819305356 0.25651053821356756; … ; -0.4233492331828929 0.013929076127145168 … 0.12727781451876424 -0.3220056051786648; -0.05740921476706312 -0.004590477627889222 … 0.33006927322971974 -0.3229902182657409], [-0.16275699771952834, 0.2715510654801558, -0.3773528046642076, -0.15805165866556825, -0.45768862798217264], BetaML.Utils.relu, BetaML.Utils.drelu), DenseLayer{typeof(identity), typeof(didentity), Float64, Matrix{Float64}, Vector{Float64}}([-0.49415310523844497 -0.025886819681528617 … 0.09224620317870791 -0.2298725180847525; -0.20528369264408397 0.40894634274263597 … 0.01065168104625569 0.04243100148415224; … ; -0.7083987613359595 0.023307802404264888 … -0.3619336136169306 -0.4825559053138102; -0.09606399030062296 -0.0076813382679077336 … -0.3824319138128976 0.21378287379211514], [-0.11178452751598777, -0.2115472973462721, 0.12029035453379433, -0.06939594013486328, -0.5177091839997635], identity, BetaML.Utils.didentity), DenseLayer{typeof(relu), typeof(drelu), Float64, Matrix{Float64}, Vector{Float64}}([-0.6379489156883928 -0.2650201076194998 … -0.9145388683760447 -0.12401807820151456], [-0.033419740504278206], BetaML.Utils.relu, BetaML.Utils.drelu)]
[DenseLayer{typeof(relu), typeof(drelu), Float64, Matrix{Float64}, Vector{Float64}}([-0.28529942833030564 0.379669223140765 … 0.28591139889714334 0.2606243753947177; -0.11852059520830227 0.01345676599232093 … -0.29706242768791313 0.23712909181525033; … ; -0.014945762311593835 0.3365486213316541 … 0.38625836286183857 -0.3815582599599021; 0.2361052810665739 0.39732182872463784 … -0.16904473533198983 0.4058193222986791], [-0.2941231824618411, 0.22676070936994097, 0.36548939215338183, 0.2223280912744705, 0.14878832348318172, 0.14237054395672044, 0.12194600561371483], BetaML.Utils.relu, BetaML.Utils.drelu), DenseLayer{typeof(identity), typeof(didentity), Float64, Matrix{Float64}, Vector{Float64}}([-0.41763559937958017 0.5557788338390783 … 0.4559073525474535 -0.36261818505175825; -0.17349638626452868 0.01969868837033595 … 0.14788575447060037 0.12932806923843965; … ; -0.021878355795233784 0.4926567361624343 … 0.053199618796913706 -0.06119821157571559; 0.34562274152460515 0.5816196024546281 … 0.41959953754300483 -0.0549751039594103], [0.4400179121658523, 0.24489574852922413, -0.19121243996167125, -0.4563330828793923, 0.2666684007070268, 0.37420770408480153, 0.06760655291977202], identity, BetaML.Utils.didentity), DenseLayer{typeof(relu), typeof(drelu), Float64, Matrix{Float64}, Vector{Float64}}([-0.5524799673028851 -0.22951414571217266 … -0.028942344264588638 0.4572159107612309], [0.7352262891458451], BetaML.Utils.relu, BetaML.Utils.drelu)]
[DenseLayer{typeof(relu), typeof(drelu), Float64, Matrix{Float64}, Vector{Float64}}([-0.27623998365144253 -0.0042939986313030865 … 0.03954785061772442 -0.08082404539953181; -0.11475707285608633 0.17436554863663706 … -0.05561917436604025 -0.21782018027072575; … ; 0.36761314457292255 0.005954470723518457 … -0.3837383360631904 0.3467117277857586; 0.013029457645517328 0.12646036547257528 … 0.22589917353995687 -0.05220438901739144], [0.38096922973233555, -0.17198944163464452, 0.3231333343145583, 0.07247817545621887, 0.2610547851810732, 0.32440076793779044, -0.36628335178017296, -0.09725122313424439, 0.005944201402634575], BetaML.Utils.relu, BetaML.Utils.drelu), DenseLayer{typeof(identity), typeof(didentity), Float64, Matrix{Float64}, Vector{Float64}}([-0.36831997820192347 -0.005725331508404152 … -0.3958593058455864 -0.009396020856098364; -0.15300943047478177 0.23248739818218278 … -0.5034837638317298 -0.42198614060305667; … ; 0.49015085943056347 0.007939294298024535 … -0.08579127354734356 0.12048358271778759; 0.01737261019402303 0.16861382063010033 … 0.4925234679180297 -0.18459818635959535], [-0.4747622464385455, -0.2650918386962326, -0.2416897178346205, -0.4434088787999071, 0.40076564807210224, 0.36252051789995865, -0.5078601012084061, -0.09079195063298717, 0.2076336496753396], identity, BetaML.Utils.didentity), DenseLayer{typeof(relu), typeof(drelu), Float64, Matrix{Float64}, Vector{Float64}}([-0.49415310523844497 -0.20528369264408397 … 0.6576063845500103 0.023307802404264888], [-0.0076813382679077336], BetaML.Utils.relu, BetaML.Utils.drelu)]Note that specifying the derivatives of the activation functions (and of the loss function that we'll see in a moment) is totally optional, as without them BetaML will use Zygote.jl for automatic differentiation.
We do also set a few other parameters as "tunable": the number of "epochs" to train the model (the number of iterations through the whole dataset), the sample size at each batch and the optimisation algorithm to use. Several optimisation algorithms are indeed available, and each accepts different parameters, like the learning rate for the Stochastic Gradient Descent algorithm (SGD, used by default) or the exponential decay rates for the moments estimates for the ADAM algorithm (that we use here, with the default parameters).
The hyperparameter ranges will then look as follows:
hpranges = Dict("layers"     => candidate_structures,
                "epochs"     => rand(copy(AFIXEDRNG),DiscreteUniform(50,100),3), # 3 values sampled at random between 50 and 100
                "batch_size" => [4,8,16],
                "opt_alg"    => [SGD(λ=2),SGD(λ=1),SGD(λ=3),ADAM(λ=0.5),ADAM(λ=1),ADAM(λ=0.25)])
Dict{String, Vector} with 4 entries:
"layers" => Vector{DenseLayer{TF, TDF, Float64, Matrix{Float64}, Vector{F…
"epochs" => [93, 64, 81]
"opt_alg" => OptimisationAlgorithm[SGD(#140, 2.0), SGD(#140, 1.0), SGD(#14…
"batch_size" => [4, 8, 16]Finally we can build the "neural network" NeuralNetworkEstimator model where we "chain" the layers together and we assign a final loss function (again, you can provide your own loss function, if those available in BetaML don't suit your needs):
nnm = NeuralNetworkEstimator(loss=squared_cost, descr="Bike sharing regression model", tunemethod=SuccessiveHalvingSearch(hpranges = hpranges), autotune=true,onfail="stop",rng=copy(AFIXEDRNG)) # Build the NN model and use the squared cost (aka MSE) as error function by defaultNeuralNetworkEstimator - A Feed-forward neural network (unfitted)We can now fit and autotune the model:
ŷtrain_scaled = fit!(nnm,xtrain_scaled,ytrain_scaled)548-element Vector{Float64}:
2.0069127136013907
1.5971932756086993
1.2757337720083926
1.4361501408576307
1.5950336482687255
1.4867881082393992
1.9071977799474276
1.2753975029191236
1.1688943831877399
1.1688943831877399
⋮
6.794583835095633
6.842848846051944
6.154557449557661
7.345775439552039
6.975105356949956
6.849738294910721
5.795300874368585
6.344163736001165
5.976695196065761The model training is one order of magnitude slower than random forests, although the memory requirement is approximately the same.
To obtain the neural network predictions we apply the function predict to the feature matrix X for which we want to generate predictions, and then we rescale y. Normally we would apply here the inverse_predict function, but as we simply divided by 1000, we multiply ŷ by the same amount:
ŷtrain = ŷtrain_scaled .* 1000
ŷtest  = predict(nnm,xtest_scaled) .* 1000
183-element Vector{Float64}:
6042.468676911658
6328.8961740566
6236.277784401693
6074.282951033997
6060.085537756271
5930.2691780337655
5788.893349324558
5427.946308056093
5738.699857616829
6177.8998385597715
⋮
3806.9970494003187
2218.198750264398
1945.6005788644766
359.76361761413636
2341.7734425647086
2710.647845950363
2690.811369203602
3045.9114901562853
2137.941793473577(rme_train, rme_test) = relative_mean_error.([ytrain,ytest],[ŷtrain,ŷtest])
push!(results,["NN",rme_train,rme_test]);The test error is lower than the one of the DecisionTree.jl random forest, while compared with the BetaML random forest it is higher or lower depending on the random seed (see the table at the end of this tutorial). Let's plot our predictions:
Again, we can start by plotting the estimated vs the observed value:
scatter(ytrain,ŷtrain,xlabel="daily rides",ylabel="est. daily rides",label=nothing,title="Est vs. obs in training period (NN)")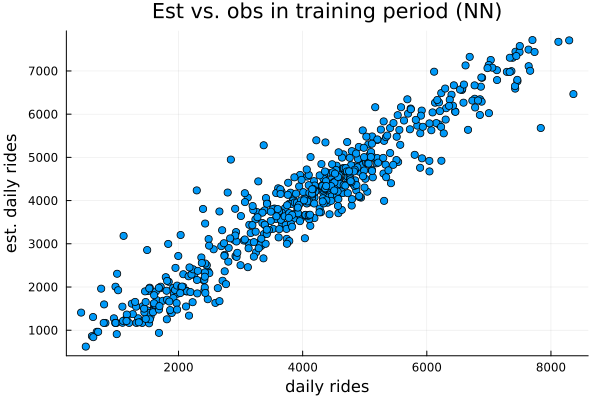
scatter(ytest,ŷtest,xlabel="daily rides",ylabel="est. daily rides",label=nothing,title="Est vs. obs in testing period (NN)")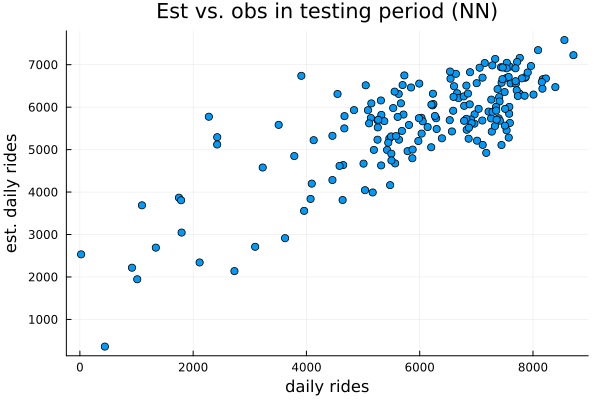
We now plot across the time dimension, first plotting the whole period (2 years):
ŷtrainfull = vcat(ŷtrain,fill(missing,ntest))
ŷtestfull  = vcat(fill(missing,ntrain), ŷtest)
plot(data[:,:dteday],[data[:,:cnt] ŷtrainfull ŷtestfull], label=["obs" "train" "test"], legend=:topleft, ylabel="daily rides", title="Daily bike sharing demand observed/estimated across the\n whole 2-years period  (NN)")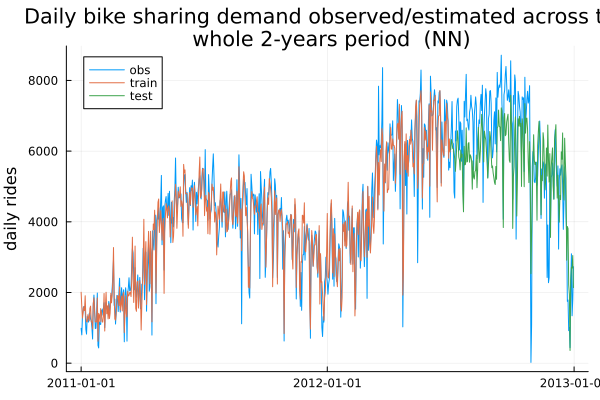
...and then focusing on the testing data
stc  = 620
endc = size(x,1)
plot(data[stc:endc,:dteday],[data[stc:endc,:cnt] ŷtestfull[stc:endc]], label=["obs" "val" "test"], legend=:bottomleft, ylabel="Daily rides", title="Focus on the testing period (NN)")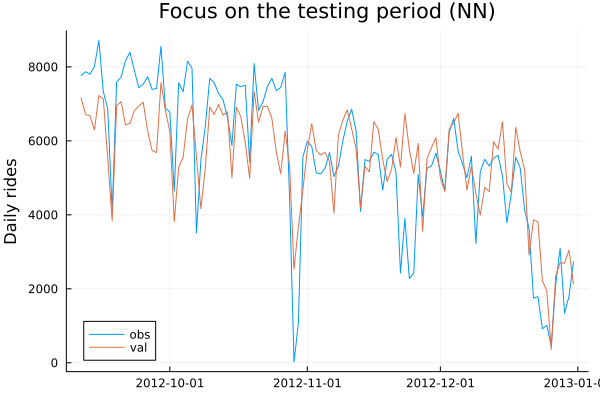
Comparison with Flux.jl
We now apply the same Neural Network model using the Flux framework, a dedicated neural network library, reusing the optimal parameters that we did learn from tuning NeuralNetworkEstimator:
hp_opt         = hyperparameters(nnm)
opt_size       = size(hp_opt.layers[1])[2][1]
opt_batch_size = hp_opt.batch_size
opt_epochs = hp_opt.epochs93We fix the default random number generator so that the Flux example gives a reproducible output
Random.seed!(seed)Random.TaskLocalRNG()Flux works with the observations along the columns and its layers have Float32 parameters, so we transpose the data and convert it to Float32:
xtrainf, ytrainf = Float32.(permutedims(xtrain_scaled)), Float32.(permutedims(ytrain_scaled))
xtestf           = Float32.(permutedims(xtest_scaled))
23×183 Matrix{Float32}:
1.73521 1.74154 1.74786 … 2.87306 2.87938 2.8857
1.0 1.0 1.0 1.0 1.0 1.0
0.447273 0.447273 0.447273 1.96027 1.96027 1.96027
0.0 0.0 1.0 0.0 0.0 0.0
1.0 1.0 0.0 0.0 0.0 1.0
1.65688 1.6523 1.69816 … -1.25052 -1.23676 -1.45688
1.4814 1.48517 1.66815 -1.35163 -1.41758 -1.4682
-1.17461 -0.875204 -0.564708 0.860243 -0.933422 -0.306886
-0.0118295 -0.904396 -0.791736 -0.928369 1.99864 -0.534478
0.0 0.0 0.0 1.0 1.0 1.0
⋮ ⋱ ⋮
0.0 0.0 0.0 1.0 0.0 1.0
0.0 0.0 0.0 … 0.0 0.0 0.0
0.0 0.0 0.0 0.0 1.0 0.0
1.0 0.0 0.0 0.0 0.0 1.0
0.0 1.0 0.0 0.0 0.0 0.0
0.0 0.0 1.0 0.0 0.0 0.0
0.0 0.0 0.0 … 0.0 0.0 0.0
0.0 0.0 0.0 0.0 0.0 0.0
0.0 0.0 0.0 1.0 0.0 0.0We define the Flux neural network model and load it with data...
l1         = Flux.Dense(D,opt_size,Flux.relu)
l2         = Flux.Dense(opt_size,opt_size,identity)
l3         = Flux.Dense(opt_size,1,Flux.relu)
Flux_nn    = Flux.Chain(l1,l2,l3)
fluxloss(m,x, y) = Flux.mse(m(x), y)
nndata     = Flux.DataLoader((xtrainf, ytrainf), batchsize=opt_batch_size,shuffle=true)
opt        = Flux.setup(Flux.Adam(0.001, (0.9, 0.8)), Flux_nn)
(layers = ((weight = Leaf(Adam(eta=0.001, beta=(0.9, 0.8), epsilon=1.0e-8), (Float32[0.0 0.0 … 0.0 0.0; 0.0 0.0 … 0.0 0.0; … ; 0.0 0.0 … 0.0 0.0; 0.0 0.0 … 0.0 0.0], Float32[0.0 0.0 … 0.0 0.0; 0.0 0.0 … 0.0 0.0; … ; 0.0 0.0 … 0.0 0.0; 0.0 0.0 … 0.0 0.0], (0.9, 0.8))), bias = Leaf(Adam(eta=0.001, beta=(0.9, 0.8), epsilon=1.0e-8), (Float32[0.0, 0.0, 0.0, 0.0, 0.0], Float32[0.0, 0.0, 0.0, 0.0, 0.0], (0.9, 0.8))), σ = ()), (weight = Leaf(Adam(eta=0.001, beta=(0.9, 0.8), epsilon=1.0e-8), (Float32[0.0 0.0 … 0.0 0.0; 0.0 0.0 … 0.0 0.0; … ; 0.0 0.0 … 0.0 0.0; 0.0 0.0 … 0.0 0.0], Float32[0.0 0.0 … 0.0 0.0; 0.0 0.0 … 0.0 0.0; … ; 0.0 0.0 … 0.0 0.0; 0.0 0.0 … 0.0 0.0], (0.9, 0.8))), bias = Leaf(Adam(eta=0.001, beta=(0.9, 0.8), epsilon=1.0e-8), (Float32[0.0, 0.0, 0.0, 0.0, 0.0], Float32[0.0, 0.0, 0.0, 0.0, 0.0], (0.9, 0.8))), σ = ()), (weight = Leaf(Adam(eta=0.001, beta=(0.9, 0.8), epsilon=1.0e-8), (Float32[0.0 0.0 … 0.0 0.0], Float32[0.0 0.0 … 0.0 0.0], (0.9, 0.8))), bias = Leaf(Adam(eta=0.001, beta=(0.9, 0.8), epsilon=1.0e-8), (Float32[0.0], Float32[0.0], (0.9, 0.8))), σ = ())),)We do the training of the Flux model...
[Flux.train!(fluxloss, Flux_nn, nndata, opt) for i in 1:opt_epochs]93-element Vector{Nothing}:
nothing
nothing
nothing
nothing
nothing
nothing
nothing
nothing
nothing
nothing
⋮
nothing
nothing
nothing
nothing
nothing
nothing
nothing
nothing
nothingWe obtain the predictions...
ŷtrainf = Flux_nn(xtrainf)' .* 1000;
ŷtestf  = Flux_nn(xtestf)'  .* 1000;
..and we compute the mean relative errors..
(rme_train, rme_test) = relative_mean_error.([ytrain,ytest],[ŷtrainf,ŷtestf])
push!(results,["NN (Flux.jl)",rme_train,rme_test]);
.. finding an error not significantly different from the one obtained from BetaML.Nn.
Plots:
scatter(ytrain,ŷtrainf,xlabel="daily rides",ylabel="est. daily rides",label=nothing,title="Est vs. obs in training period (Flux.NN)")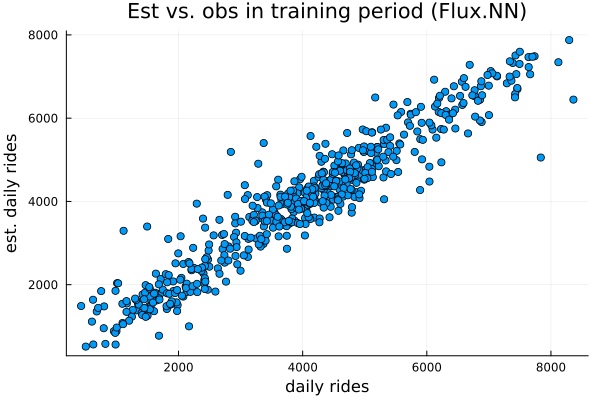
scatter(ytest,ŷtestf,xlabel="daily rides",ylabel="est. daily rides",label=nothing,title="Est vs. obs in testing period (Flux.NN)")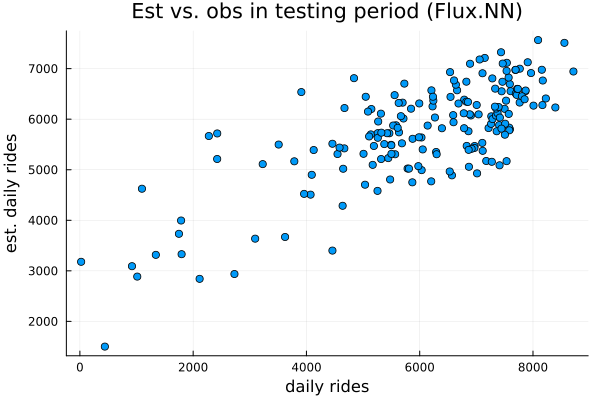
ŷtrainfullf = vcat(ŷtrainf,fill(missing,ntest))
ŷtestfullf  = vcat(fill(missing,ntrain), ŷtestf)
plot(data[:,:dteday],[data[:,:cnt] ŷtrainfullf ŷtestfullf], label=["obs" "train" "test"], legend=:topleft, ylabel="daily rides", title="Daily bike sharing demand observed/estimated across the\n whole 2-years period (Flux.NN)")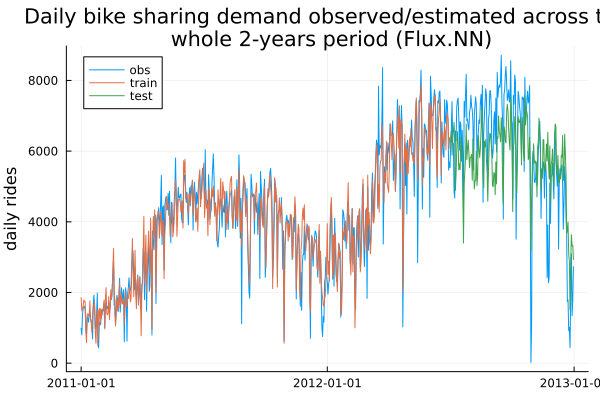
stc = 620
endc = size(x,1)
plot(data[stc:endc,:dteday],[data[stc:endc,:cnt] ŷtestfullf[stc:endc]], label=["obs" "val" "test"], legend=:bottomleft, ylabel="Daily rides", title="Focus on the testing period (Flux.NN)")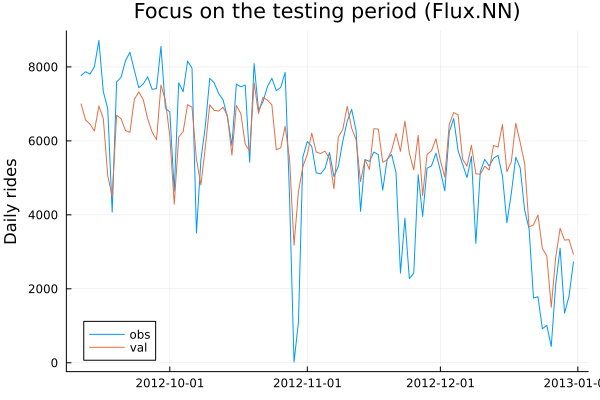
Conclusions of Neural Network models
If we strive for the most accurate predictions, deep neural networks are usually the best choice. However they are computationally expensive, so with limited resources we may get better results by fine tuning and running many repetitions of "simpler" decision trees or even random forest models than a large neural network with insufficient hyper-parameter tuning. Also, we should consider that decision trees/random forests are much simpler to work with.
That said, specialised neural network libraries, like Flux, allow the use of GPUs and specialised hardware, letting neural networks scale with very large datasets.
Still, for small and medium datasets, BetaML provides simpler yet customisable solutions that are accurate and fast.
GMM-based regressors
BetaML 0.8 introduces new regression algorithms based on Gaussian Mixture Models. Specifically, there are two variants available, GaussianMixtureRegressor2 and GaussianMixtureRegressor, and this example uses GaussianMixtureRegressor As for neural networks, they work on numerical data only, so we reuse the datasets we prepared for the neural networks.
As usual we first define the model.
m = GaussianMixtureRegressor(rng=copy(AFIXEDRNG),verbosity=NONE)GaussianMixtureRegressor - A regressor based on Generative Mixture Model (unfitted)We disabled autotune here, as this code is run by GitHub continuous_integration servers on each code update, and GitHub servers seem to have some strange problem with it, taking almost 4 hours instead of a few seconds on my machine.
We then fit the model to the training data..
ŷtrainGMM_unscaled = fit!(m,xtrain_scaled,ytrain_scaled)548×1 Matrix{Float64}:
2.0545695951498804
2.05456959514988
2.05456959514988
2.05456959514988
2.05456959514988
2.05456959514988
2.05456959514988
2.05456959514988
2.05456959514988
2.05456959514988
⋮
5.525359181472883
5.525359181472883
5.525359181472883
5.525359181472883
5.525359181472883
5.525359181472883
5.525359181472883
5.525359181472883
5.525359181472883And we predict...
ŷtrainGMM = ŷtrainGMM_unscaled .* 1000;
ŷtestGMM  = predict(m,xtest_scaled)  .* 1000;

(rme_train, rme_test) = relative_mean_error.([ytrain,ytest],[ŷtrainGMM,ŷtestGMM])
push!(results,["GMM",rme_train,rme_test]);
Summary
This is the summary of the results (train and test relative mean error) we had trying to predict the daily bike sharing demand, given weather and calendar information:
println(results)6×3 DataFrame
Row │ model train_rme test_rme
│ String Float64 Float64
─────┼───────────────────────────────────────────
1 │ DT 0.0506243 0.162542
2 │ RF 0.0409782 0.13549
3 │ RF (DecisionTree.jl) 0.0539132 0.259739
4 │ NN 0.0886451 0.159544
5 │ NN (Flux.jl) 0.0931534 0.164075
6 │ GMM 0.216144 0.243844You may ask how stable these results are. How much do they depend on the specific RNG seed? We re-evaluated the whole script a couple of times, changing the random seeds (to 1000 and 10000, obtained with Julia 1.10, other Julia versions may give slightly different results):
| Model | Train rme1 | Test rme1 | Train rme2 | Test rme2 | Train rme3 | Test rme3 |
|---|---|---|---|---|---|---|
| DT | 0.0213416 | 0.172881 | 0.0507250 | 0.143607 | 0.1270030 | 0.148203 |
| RF | 0.0557363 | 0.177997 | 0.0507030 | 0.138829 | 0.0408240 | 0.145779 |
| RF (DecisionTree.jl) | 0.0098861 | 0.252646 | 0.0145270 | 0.221290 | 0.0266340 | 0.219570 |
| NN | 0.0944757 | 0.226690 | 0.0877910 | 0.116039 | 0.0949880 | 0.149912 |
| NN (Flux.jl) | 0.0826919 | 0.182983 | 0.1227420 | 0.191399 | 0.0923670 | 0.130626 |
| GaussianMixtureRegressor* | 0.2161440 | 0.243844 | 0.2161440 | 0.243844 | 0.2161440 | 0.243844 |
- GMM is a deterministic model, and here its results don't depend on the random seed
Neural networks can be more precise than random forest models, but are more computationally expensive (and tricky to set up). When we compare BetaML with the algorithm-specific leading packages, we find similar results in terms of accuracy, but often the leading packages are better optimised and run more efficiently (but sometimes at the cost of being less versatile). GMM-based regressors are very computationally cheap and a good compromise if accuracy can be traded off for performance.
This page was generated using Literate.jl.